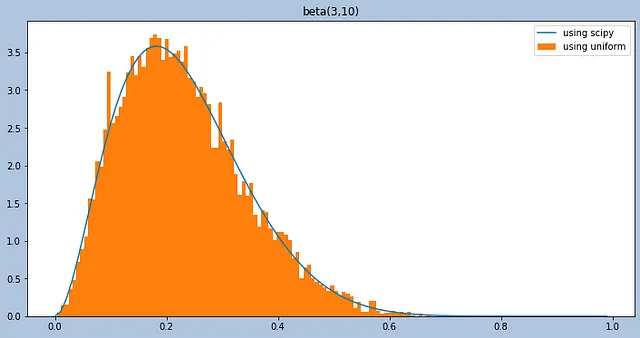
How to create a random variable with a Beta distribution from scratch, using only Uniform random variables
You can use software, like scipy.stats.beta if you want to sample from a Beta distribution. But you can also create a Beta distribution yourself — from scratch. The only thing you need is access to a Uniform random variable. This post shows an implementation of example 12.1.4 on p. 539 of the book “Introduction to